Spectral analysis of function composition
Collaboration with: Daniel Weiskopf, Torsten Möller, and Dave Muraki
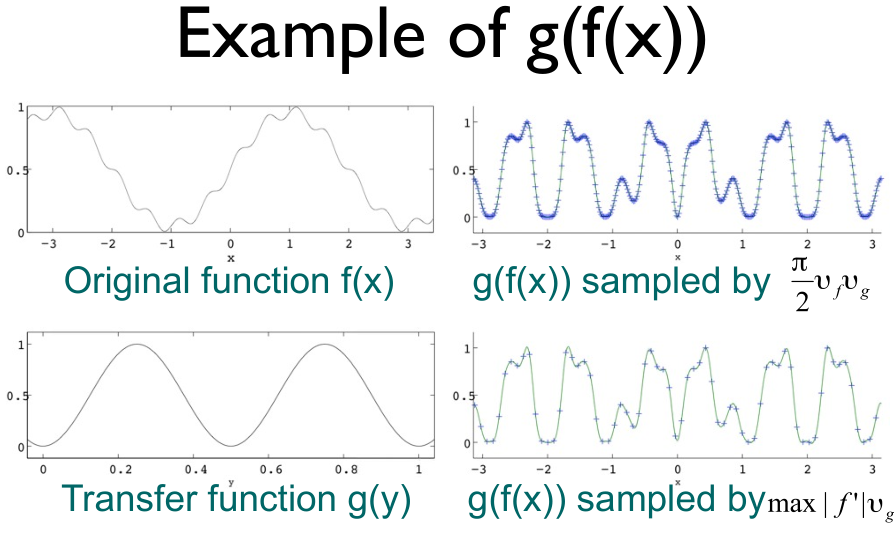
Before rendering, data values $f(x)$ at given spatial positions $x$ have to be assigned optical properties and visibility. In mathematical terms this corresponds to function composition $g(f(x))$. We describe the composition as a linear operator and conduct a spectral analysis to estimate a suitable sampling frequency in $x$ to reconstruct the composed signal. We put the theoretical insight to practical effect by implementing a raycaster with an adaptive sampling scheme based on our new estimate.
This work is described in a IEEE TVCG paper (bibtex) and has been presented at IEEE Visualization 2006. See also Chapter 4 of my PhD thesis (PDF) for slightly updated notation.
 We study function composition as a fundamental data processing step.
Assuming bandlimiting frequencies $\nu_f$ and $\nu_g$ of the two functions $f$ and $g$, respectively,
a less conservative, coarser sampling rate is derived that still
enables accurate reconstruction of the composed function $g(f(x))$ refered to as $h$ in the following.
Hint for reading the paper
The simplified explanation provided below treats the problem for one-dimensional functions $f, g:\RR\to\RR$ and avoids the use of polar coordinates to represent combinations of frequencies $k,\,l$.
The paper’s main result is that $\nu_h = \nu_g\max_x|f’(x)|$ (Eq. 13). In other words, the quasi-bandlimiting frequency $\nu_h$ of the composed function $h$ is proportional to the extremal slope of $f$ times the bandlimiting frequency $\nu_g$ of $g$.
The relevance of having an estimate for the bandlimit $\nu_h$ of the composed function is that Shannon’s sampling theorem implies a step size $T\sim 1/\nu_h$ for a uniform sampling of $h$ that enables its perfect reconstruction.
To follow the derivation of Eq. 13, first note that Eqs. 6 & 7 imply that if $P(k, l)\approx 0$ for all $k>\nu_h$, the resulting frequency spectrum $H$ of the function $h$ is going to have a (quasi) bandlimit $\nu_h$. Inspecting the form of $P(k,l)=\int_\RR e^{ilf(x)-kx}dx$ (Eq. 5) in Section 3.2, we recognize it as an integral over an oscillating integrand with unit magnitude and phase $u(x)=lf(x)-kx$.
Stationary phase approximation is a standard analytic method that enables an approximation of the integral $P(k,l)$ by only considering contributions of its integrand where the phase of oscillation $u$ “slows down to a halt”, i.e. where $du/dx=0$, refering to such points as $x_s$. Since Eq. 5 integrates over $x$, the parameters $k$ and $l$ of $u$ can be considered constants in the integral and stationary phase will occur wherever $k/l=f’(x_s)$. Now, the result in Eq. 13 can be established if the slope $f’$ of $f$ is bounded and noting that the largest frequency $l$ of relevance to non-zero portions of the spectrum $H$ in Eq. 6 is $\nu_g$, the bandlimit of $g$.
The paper follows a different path of explanation to satisfy further technical conditions of the method and also to obtain a further statement about the “quasi”-ness of the bandlimit $\nu_h$, i.e. showing that $H$ decays exponentially beyond this limit.