Paraview tutorial
Steven Bergner
October 15th, 2018
Sources
- Many tutorials with example data
- Kitware
- DKRZ
- R. Ponzini HPC/OpenFOAM post-processing in Paraview (data)
- BU tech
Data for today in the lab
- Download data to
/tmp/<username>on your lab machine and startparaview:mkdir -p /tmp/$LOGNAME cd !$ wget http://vault.sfu.ca/index.php/s/xMj3gafODzHiQOt/download -O pvtut-data.tgz tar xzf pvtut-data.tgz cd pvtut-data /usr/shared/CMPT/big-data/ParaView-5.6.0-RC3-MPI-Linux-64bit/bin/paraview
Workflow to make a figure
- Create a data source (load data)
- Inspect available variables and ranges
- Adjust view and display settings
- Adjust visual representation and coloring
- Adjust text and legend
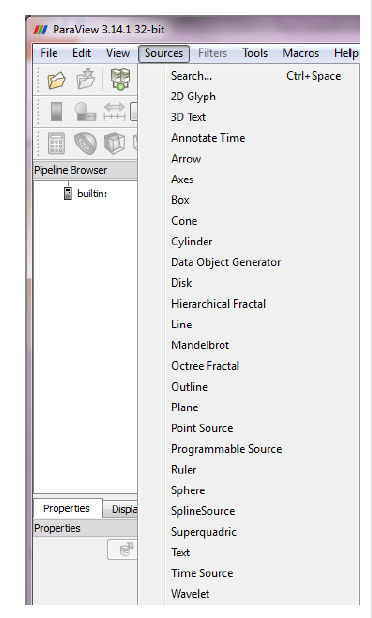
Sources
Add data to 3D scene
- as VTK source objects
- load files using readers
Filters
Customized Filters
Work with filters
Perform basic filtering on the provided data
- Slice
- Iso-surface
- Extract surface to apply smoothing
- Clipping
Advanced: Motorbike
- Smaller dataset (obtained via clipping)
- Contour plot of iso-Q
- Extract the isosurface
- Smooth
- Save the surface for future visualization
- Color by velocity or pressure or both and compare
- Build a filter that will do all the work in a single click
- Add text and colorbar
- Save meaningful visualizations
Motorbike - field meanings
- Turbulence fields
- k: turbulence kinetic energy
- nut: eddy kinematic viscosity
- omega: specific dissipation rate
- Q criterion: second invariant of the velocity gradient tensor
- Forces
- p: pressure
- U: velocity field
- UNear: velocity near wall
- wallShearStress